SmartFlexo License Manager
License Manager is a local self-service licensing application that works in conjunction with an online License Center application. When SmartFlexo is purchased a 16-digit security key will be supplied to enable the SmartFlexo screening engine. The same set of applications can be used to enter a 16 digit trial security code.
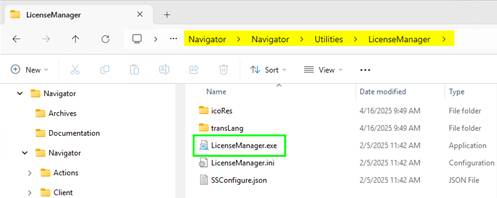
First, launch the License Manager application. C:\Navigator\Navigator\Utilities\LicenseManager\LicenseManager.exe
Click the Activation Button.

License Activation

Online activation
Click Online activation to activate the license over an internet connection.
Enter the trial code supplied to you from Xitron or your Xitron dealer.

Click Online activation.
A successful activation message will be displayed when the code has been activated successfully
The license manager now will display information and status of your license.

Offline activation (No internet access)
Click Generate c2d if your PC is not on the internet, but files can be generated and copied from the PC
. 
- Generate the c2d file by clicking the c2d button to save the file. Copy c2d file to a network machine that has internet access.
- Go to https://user.lm.virbox.com from the machine that has internet access.
- Log in to the License Center by entering your SmartFlexo license code.
- Once logged in, scroll to Offline Binding.
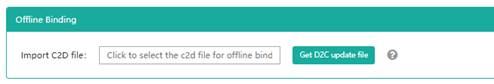
- Click the button to upload the c2d file you generated.
- Click Get D2C update file.
- Save D2C file and copy it to the SmartFlexo PC
- Import the D2C file by clicking the Import d2c button in the Generate c2d file window.
Offline activation (No internet access or saving capability)
Click short-c2d if you don’t have internet access and can’t save files from the PC. Follow the steps on screen.

- Copy and paste the short-c2d code that displays in the window and paste it somewhere like notepad.
- Go to https://user.lm.virbox.com from the machine that has internet access.
- Log in to the License Center by entering your SmartFlexo license code.
- Once logged in, scroll to Offline Binding (Use Simplified C2D).
- Paste the short-c2d code.

- Click Get D2C update file.
- Save D2C file and copy it to the SmartFlexo PC
- Import the D2C file by clicking the Import d2c button in the Generate c2d file window.
Other Tools
View License Information
View License button. If you are using a trial code, trial licenses time will display in this window.

Unbind a License Online
If the internet is available a SmartFlexo license from an existing PC can be unbound over the internet by clicking the Online Unbind button. An Online bind window will display. The application will automatically fill in the field for Auth/Borrow serial number.
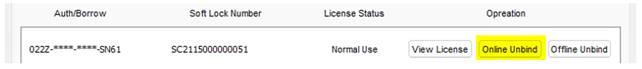

Click online Unbind button. The license will then unbind to the PC.
Unbind a License Offline
If the internet is not available, a SmartFlexo license from an existing PC can be unbound offline by clicking the Offline Unbind button.

A browser window will display allowing the user to select a destination folder to save c2d file.

Log into the License Center web page https://user.lm.virbox.com. (See using License Center).
Once logged in scroll to the Offline Unbind tool.

Click the button to select the c2d file saved earlier. Click Start unbind to unbind the license.
Using the License Center
The license center is an online web application that can be used to manage your SmartFlexo license.
Go to the License Center website https://user.lm.virbox.com
Enter your license code number and click Sign In.

You will now have access to your license code information and tools.

SmartFlexo Applications
A screening template and curve file are required to generate SmartFlexo TIFFs. The SmartFlexo package includes a screening template editor and a curve editor. Several default screening templates and curves have been created to help you get started out of the box. See section SmartFlexo Screening Start Points for details.
The template editor can be accessed by opening any web browser either on the same computer Navigator is installed on or another computer in your network.
 Default address for local access.
Example: http://localhost:81/SmartFlexo/screeningTemplates.html
- For network access use the same IP address as the Navigator web server.
Example: http://172.21.155.12:81/SmartFlexo/screeningTemplates.html
When the web page opens, you will see two tabs: one to access a page for screening templates and another for curves.
Screening Templates page

Curves page
Screening Template Editor
Resolution, Screen Level Screen, Angle Set, Define Spot Colors
|
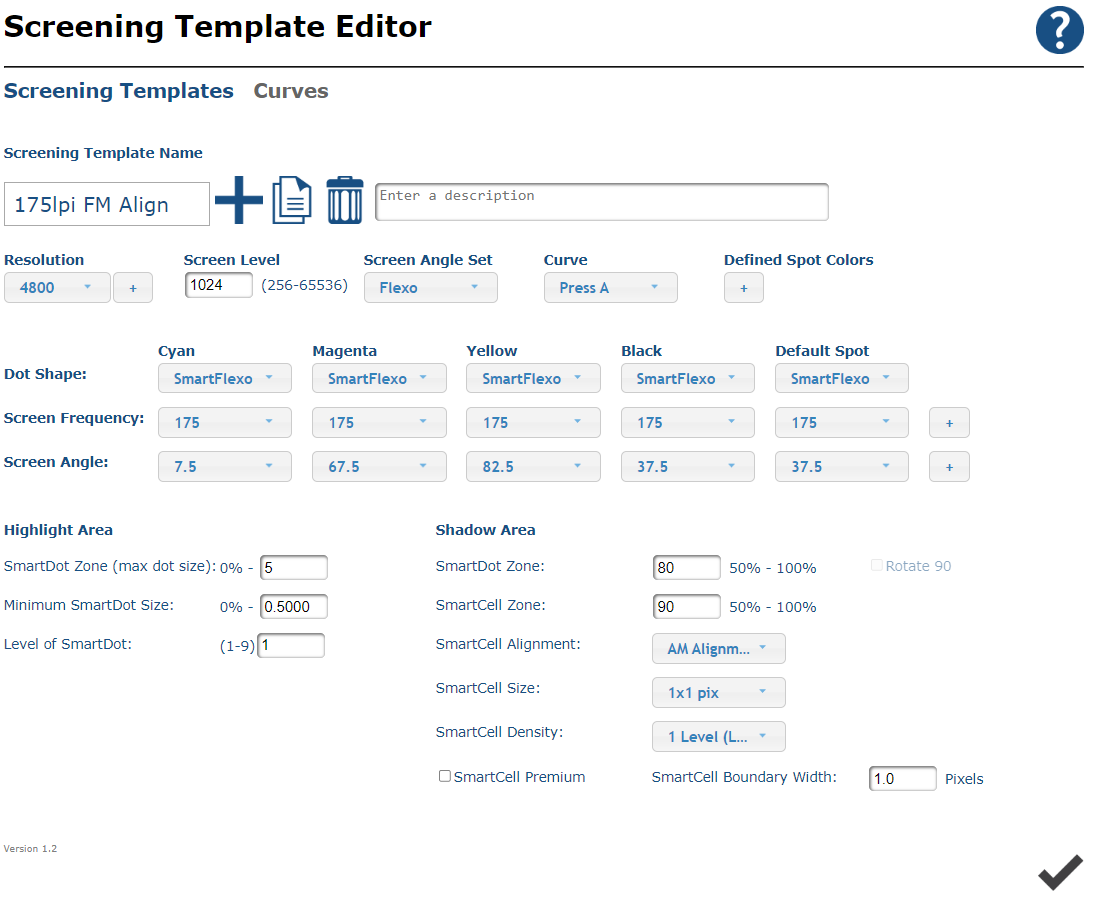
Resolution: Select 1bit tiff resolution. A custom resolution can be added by clicking the plus button and entering the desired resolution.
Screen Level: Enter the screen level value for the desired levels of gray. Range 256-65536.
Screen Angle Set: Selected angle set will populate values for C, M, Y, K, Default Spot
Following selections populate default screen angle values:
- Flexo: Cyan 7.5, Magenta, 67.5, Yellow, 82.5, Black 37.5, Default Spot 37.5
- Offset: Cyan 15, Magenta, 75, Yellow, 0, Black 45, Default Spot 15
Note: Angles can be modified. See Screen Angle description later in this document.
Define Spot Colors: SmartFlexo has settings for separations Cyan, Magenta, Yellow, Black, and Default Spot. Additional spot color rules can be added by clicking the “ + “ button below Defined Spot Colors.
The user defined Spot Color window will display. Click the “ + “ button to enter a new spot color name. The screen frequency and angle are then set from selections in the dropdown list. Repeat the process for additional spot color definitions. To view the list of spot colors defined, click the dropdown menu next to Spot Color Name. Defined spot colors can be removed by clicking the “ - “ button. Click OK to save the spot colors to the screening template.
The “ + “ button will turn into an Edit button when spot colors are defined in a template.
No Colors Defined | Custom spot color definition window | Colors Defined |
|
|
|


Screen Frequency, Screen Angle
Screen Frequency: Select a screen frequency from the dropdown list. Additional screen frequencies can be added.
Click the plus button and enter desired frequency. The new screen frequency will now be available as a choice in the dropdown list.
Screen Angle: Screen angle values for each color are predefined based on the Screen Angle Set selected. The default angles available coordinate with these selections below.
- Flexo selection will have angle set 7.5, 67.5, 82.5, 37.5 available in the dropdown selector.
- Offset selection will have angle set 15, 75, 0, 45 available in the dropdown selector.
A custom screen angle can be added to the screen frequency dropdown list. Click the plus button and type enter the additional angle value. The new value will now be selectable from the dropdown.
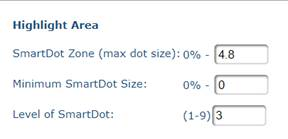
Highlight Area
There are three settings used in determining the size and placement of SmartDots in highlight areas as shown in Figure 1 below:
- SmartDot Zone: This entry controls two functions. The first is the point below which SmartDots will become enabled, changing from regular AM halftone dots to FM halftone dots. The second is the maximum size of SmartDots. In our examples, that number is 5%.
- Minimum SmartDot Size: This number should be something less than the minimum printable dot and will vary according to platesetter and plates used. It will establish a baseline for giving structure to the floor of the plate and the printing dots. The smallest setting used in our examples is 0.5 but could be smaller or larger according to conditions.
- Level of SmartDot: The structural SmartDots can be made larger or smaller with this setting. Level 1 SmartDots will be the same size as the Minimum SmartDot size entered earlier. Levels 2-9 will exponentially increase the size of the structural dot up to the maximum entered in the SmartDot Zone window.
Figure 1 |
|

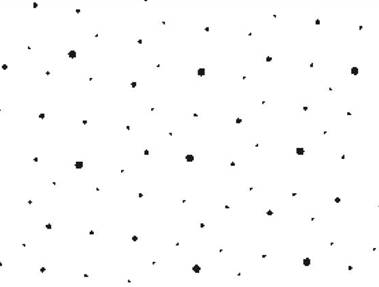
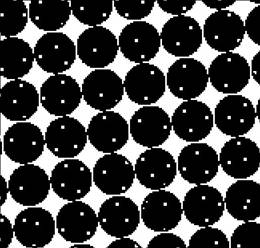
Level of SmartDot – Examples
All examples shown are output at a final resolution of 4800 dpi with a 175 lpi frequency setting using a 5% maximum SmartDot. The screen grabs are magnified for the sake of clarity and each sample comes from a 3% gray tint. The specific SmartDot settings are noted for each set of examples.
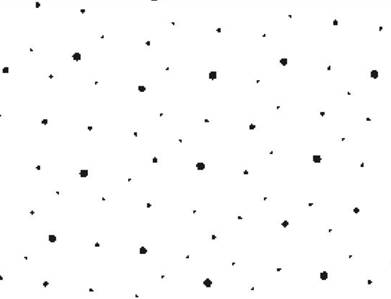
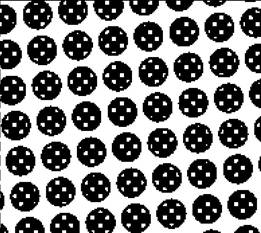
Example 1 – Smart Dot Size at 0.5%
Level 1 SmartDot | Level 3 SmartDot |
|
|
Level 5 SmartDot | Level 9 SmartDot |
|
|

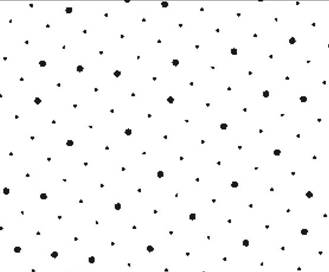
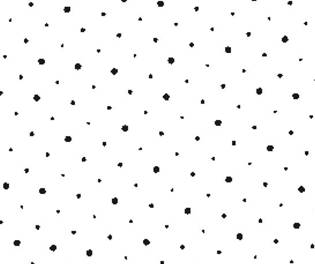
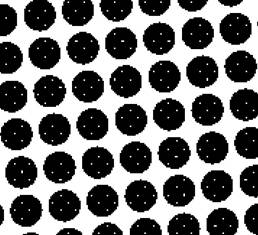
Example 2 – Smart Dot Size at 1.0%
Level 1 SmartDot | Level 3 SmartDot |
|
|
Level 5 SmartDot | Level 9 SmartDot |
|
|


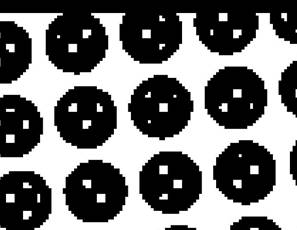
Example 3 – Smart Dot Size at 1.5%
Level 1 SmartDot | Level 3 SmartDot |
|
|
Level 5 SmartDot | Level 9 SmartDot |
|
|


Shadow Area Overview
There are several variables available in the SmartCell settings area as shown in Figure 3 below.
- SmartCell Zone: Determines the point at which the system will begin removing pixels from a given area, or zone. For instance, entering the number 90 will tell the system to remove pixels in any areas that constitute 90-100% density. Enter any number between 1 and 100.
- SmartCell Size: Choose a square or non-square number of pixels for removal, up to 6 x 6.
- SmartCell Alignment: There are several selections that affect the removal of pixels in the SmartCell Zone.
They are:- Don’t Apply – Turns off the SmartCells so none are removed.
- AM Alignment – Removes pixels in an AM (consistent and structured) alignment much like halftone dots.
- FM Alignment – Removes pixels in an FM (random or stochastic) alignment.
- AM Non-Square Alignment – Removes pixels in an AM alignment with non-square pixel dimensions such as 1 pixel by 3 pixels.
- AM Non-Square Alignment WPR – Removes pixels in an AM alignment while automatically reducing the number of pixels removed as halftone dots get smaller.
- FM Non-Square Alignment WPR – Removes pixels in an FM alignment while automatically reducing the number of pixels removed as the halftone dots get smaller.
- AM Non-Square Alignment - Removes non-square pixels in an AM alignment while automatically reducing the number of pixels removed as halftone dots get smaller.
- SmartCell Density – Increases or decreases the overall population of removed pixels from Level 1 (low) to
Level 7 (high). - SmartCell Boundary Width – Instructs the system not to remove pixels near the edge of a halftone dot.
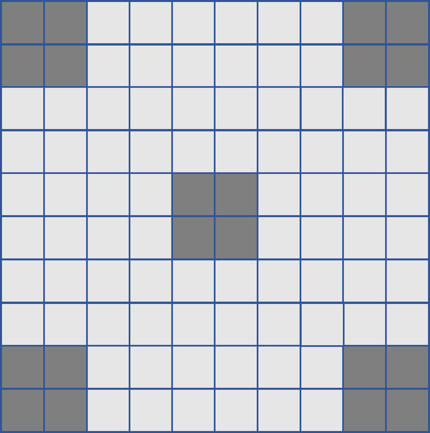
- SmartCell Premium – Surface Screening or Micro-Surface Structures are applied primarily to enhance the ink-laydown performance of a flexo plate, addressing reticulation and pin-holing problems. Other benefits include the elimination of common flexo faults such as trailing edge voids, filling-in and halos. These are most valuable when printing solvent-based inks onto film substrates. Effective surface screens alter the surface energy of the plate to enhance its ink transfer properties. This can be achieved most efficiently with ‘positive’ structures on the print surface, i.e. a small standing area the size of just a few microns, with a space around it. SmartCell Premium allows the user to define the size of the standing area in pixels, then the density of the cell pattern.
See below examples of SmartCell 2x2 pixel patterns, density 7 is a ‘chequerboard’ pattern then as density value decreases, the pattern becomes more spread out or a lower pattern frequency.
SmartCell Premium – 2x2 pixels | SmartCell Premium – 2x2 pixels | SmartCell Premium – 2x2 pixels |
|
|
|
Note that the same range of structure sizes and densities can also be applied as a stochastic FM-Aligned pattern. | ||


SmartDot Zone and Smart Cells
There are several settings available for changing the halftone dot response in shadow areas. These are divided between SmartDot Zone and SmartCells. The entry for SmartDot Zone determines the point at which the system will change from AM screening to FM screening. SmartCells are pixels the system will remove from solid areas to affect uniform ink coverage and ink savings in solid areas. SmartCell settings can be used in conjunction with SmartDot Zones, or either of the two can be used exclusively, depending on the desired response. The entry window for SmartDot Zone is shown below in Figure 2. Any integer between 85 and 100 may be entered.
Figure 2. |
|

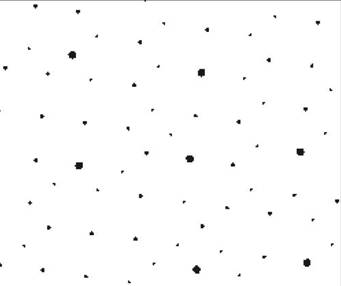
SmartDot Zone Effect of SmartCell Zone Examples
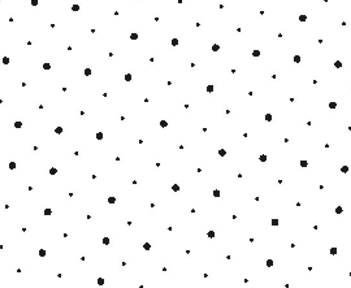
The examples below illustrate the effects of different SmartDot Zone settings when not applying SmartCell criteria.
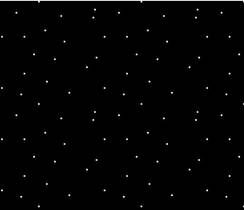
SmartDot Zone 90-100
![]()
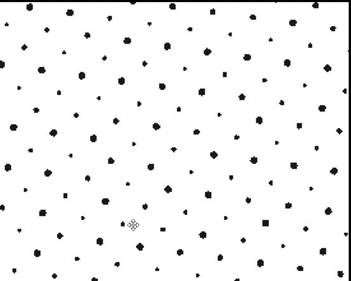
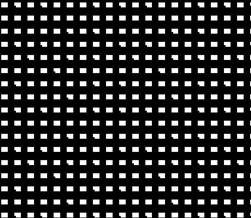
SmartDot Zone 94-100
![]()
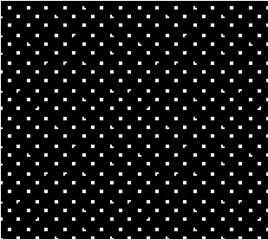
SmartDot Zone 96-100
![]()
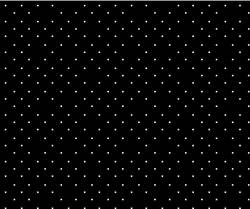
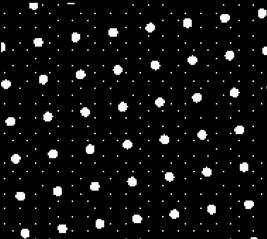
SmartDot Zone 98-100
![]()
SmartCell Alignment Examples
The following examples show the effects of pixel removal using various SmartCell settings in 100% solid areas. All examples shown are at a final resolution of 4800 dpi with a 175 lpi frequency setting and magnified to show pixels.
AM Alignment and FM Alignment examples.
AM Alignment, 1pixel x 1 pixel SmartCell, | FM Alignment, 1 pixel x 1 pixel SmartCell, Level 1 |
|
|
AM Alignment, 1 pixel x 1 pixel SmartCell, | FM Alignment, 1 pixel x 1 pixel SmartCell, Level 3 |
|
|
AM Alignment, 1 pixel x 1 pixel SmartCell, | FM Alignment, 1 pixel x 1 pixel SmartCell, Level 5 |
|
|


Using the AM Non-Square Alignment selection will disable the SmartCell Density menu as the density for non-square pixels is pre-set. The examples below show the results of various selections.
AM Non-Square Alignment, | AM Non-Square Alignment, |
|
|

Using the AM Alignment WPR selection will allow the system to automatically reduce the population of pixel removal based on the size of the halftone dot. Below are examples of the effect based on a variety of settings.
AM Alignment with APR, 2 pixels x 2 pixels, | AM Alignment with APR, 2 pixels x 2 pixels, |
|
|
AM Alignment with APR, 2 pixels x 2 pixels, | AM Alignment with APR, 2 pixels x 2 pixels, |
|
|
AM Alignment with APR, 2 pixels x 2 pixels, | AM Alignment with APR, 2 pixels x 2 pixels, |
|
|


Using the FM Alignment WPR setting will also instruct the system to automatically reduce the population of pixel removal as halftone dots get smaller but will do so in the FM format. Below are examples of the effects using the same settings shown for AM alignment above.
FM Alignment with APR, 2 pixels x 2 pixels, Level 3 at 100% | FM Alignment with APR, 2 pixels x 2 pixels, Level 3 at 95% |
|
|
FM Alignment with APR, 2 pixels x 2 pixels, Level 3 at 75% | FM Alignment with APR, 2 pixels x 2 pixels, Level 3 at 55% |
|
|


The following examples illustrate the wide range of variability in SmartFlexo, which allow it to account for different press conditions. Shown below is a comparison between AM Alignment and AM Alignment with APR with the same pixel settings.
AM Alignment, 3 pixels x 3 pixels, | AM Alignment WPR, 3 pixels x 3 pixels, |
|
|
In the AM Alignment sample, the system maintains the 3 x 3, Level 5 pixel count throughout the screened area. In the AM Alignment WPR sample, the system automatically reduces the number of pixels removed based on the size of the halftone dot.
The following examples show the ability to protect the edges of halftone dots so that no pixels are removed that might change the shape of the dot itself. The magnifications have been increased for these examples.
Edge Protection Setting 2 pixel | Edge Protection Setting 4 pixels |
|
|

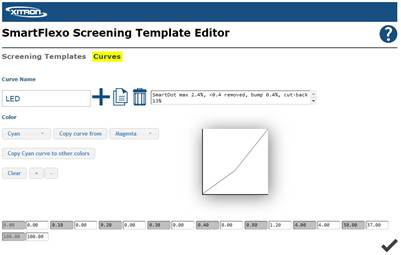
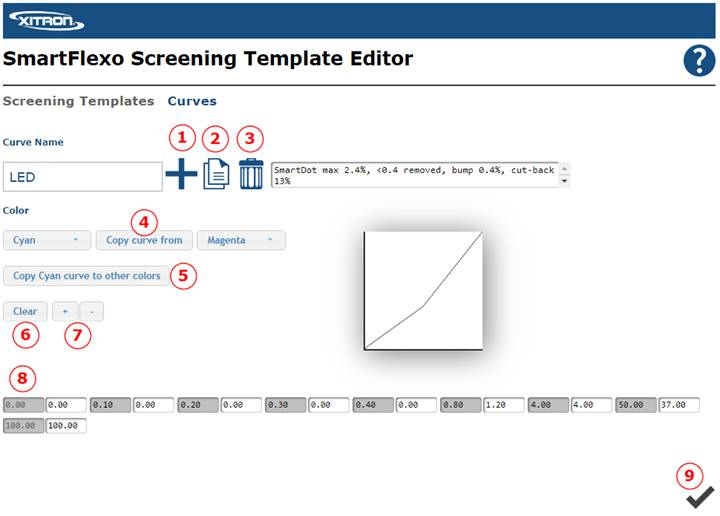
Curves Editor
The Curves tab allows users to create custom curves that can then be selected in a screening template. The application allows the user to enter a custom control point percentage (X) and percentage for that control point. Specific controls for this page are outlined below.
- Creates new curve and prompts user for a curve name.
- Copy curve currently selected.
- Delete selected curve.
- Copies existing curve data to channel on the right.
- Copies data from Color selected on the left to all color channels.
- Clears all curve data.
- Add or remove custom control points.
- Custom control points entered with desired curve values.
- Saves curve.
Creating a New Curve
Click the plus button. A dialog box will appear allowing you to enter a curve name. New curves will initially have 2 control points 0% and 100%. The value in grey is the reference value (X). The value in white is the sample value which is the desired percentage for screened output (Y).
![]()
Adding Control Points
This curve application allows users to add 22 additional control points. To add a new control point, click the plus button. A window will appear allowing the user to enter the reference control point. In this example we are going to enter 25%.
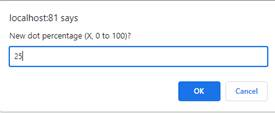
Click ok to enter the sample value (desired percentage) for the new control point. If you don’t know the value now,
just enter the same value as the reference. Adjustments can be done in the curve page later.

Click OK. You will now see 25% inserted between 0% and 100%.
![]()
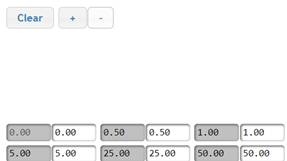
Repeat the process for additional control points. The application will automatically place the new points in the correct order from 0% - 100%.
Removing Control Points
To remove a control point. Click on the control point you wish to remove and click the minus button. The point will be removed for that color channel.
|
|

Copy Channel Curve Data to Other Channels
During tone curve creation or modification, it is possible to select the color with values you wish to apply to other color channels, from the channel on the left. An example of this would be if you wanted to copy the values that you made for Cyan and apply those values to Magenta.
If curve data is the same for all colors, simply click the “Copy {color} curve to other colors” button. The name of the button changes depending on the color currently selected on the left. The example will copy cyan data to all colors.

Default Curve – Test File
Just for reference and starting point, the installation includes a Default curve with 20 control points. A PDF file is in the Sample Files folder. Navigator/Navigator/Sample Files/SmartFlexo_TestChart.
Navigator RIP Configuration
The Navigator RIP can generate separated contone tiffs that are then sent to the SmartFlexo action for screening.
Configuring a Page Setup for Contone tiff Output
- Open Page Setup manager click New or select and copy an existing page setup.
- Select Tiff for Device and click Configure device…
- Select Template-based for file name generation. (See below)
- In template field use <jobonly> (<sepname>)_<page#>.TIF
- Click Configure and check these boxes under “Conventional name generation”:
- Use jobname as stem
- Del Page num prefix
- Use jobname unchanged
- Select a separation style that is contone or create new contone separated style.
- Select or enter resolution that matches platesetter output resolution.
- Click OK
- Name page setup
- Repeat process for other resolutions.

Workflow Options
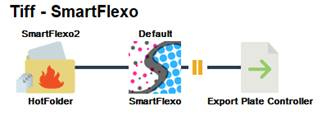
Option 1 – PDF to SmartFlexo
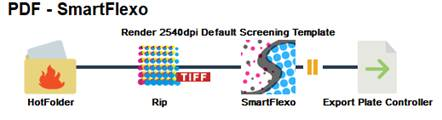
Configuration Option 1
Workflow Option 1 consists of a hot folder, RIP, SmartFlexo, and an export for sending the screened tiffs to Xitron Plate Controller hot folder.
Steps to configure:
- From Navigator Client select dropdown Workflows and select New Workflow.
- Give the workflow a name.
- From the action list on the left, drag and drop RIP after the hot folder.
- Select the appropriate page setup for rendering contone tiffs.
- Click TIFF Mode check box.
- Drag SmartFlexo action and place after the RIP action.
- Select a SmartFlexo screening template.
- Check Pause After to view SmartFlexo tiffs before releasing.
- Drag export action and place after SmartFlexo
- Click the pencil icon to save the workflow.
- Repeat the creation process or copy and make changes to existing workflow for additional configurations.

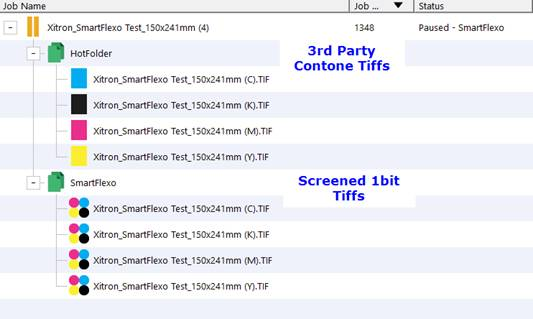
Option 2 – Contone Tiffs to SmartFlexo
Use this workflow if you are using a third-party RIP to generate contone tiffs for SmartFlexo.
Configuration Option 2
Workflow Option 2 consists of a hot folder with tiff naming template, SmartFlexo, and an export for sending the screened tiffs to Xitron Plate Controller hot folder.
Configure your third-party RIP to export separated contone tiffs to desired hot folder workflows.
Steps to configure:
- From Navigator Client select dropdown Workflows and select New Workflow.
- Give the workflow a name.
- Click on the Hot folder in the workflow window.
- Check box next to Use Color and Name Recognition.
- Select naming template SmartFlexo Tiff IN from the dropdown menu.
- Drag SmartFlexo action and place after the RIP action.
- Select a SmartFlexo screening template.
- Check Pause After to view SmartFlexo tiffs before releasing.
- Drag export action and place after SmartFlexo
- Click the pencil icon to save the workflow.
- Configure your third-party RIP to export separated contone tiffs to a workflow hot folder.
- Tiff naming convention – jobname (color).TIF
Repeat the creation process or copy and make changes to existing workflow for additional configurations.
SmartFlexo Screening Starting Points
As there are so many variations in flexo platemaking and printing, one guide would be insufficient.
The objective here is to give 3 main scenarios and provide a ‘start point’ of screening and curves so the user may adapt to their own requirements.
The following examples have been included with your installation of SmartFlexo. The examples are set for 150 lpi
(54 lpcm) dot screens. Slight adjustment of the bump-up may be necessary for other screens.
The 3 main options are:
#1 Standard bank light UVA tube exposure, solvent plates
#2 Bank light with Flat-Top-Dot plates
#3 High Power LED exposure
These templates are for the user to understand the basic settings. All key parameters such as file resolution, line-screen lpi and angles can easily be adjusted. Calibration curves are also straight-forward to edit and adapt.
- For standard Bank Light UVA main exposure in combination with standard solvent wash-out plates. Note that standard thermal plates will be similar. Water washable plates will usually be more like #2 (below), flat-top-dot plates.
SmartDot Highlight parameters:
 In combination with Curve:

This curve will remove pixels with values of 0.4% and below (‘scum dots’) by mapping them to 0%. A small cut-back curve, 5%, mapping 50% to 45% is applied as dot-loss is high anyway. A bump-up curve of 2.4%, mapping 0.8 to 3.2% should ensure stable dots are retained on the plate. These should be checked and adjusted. SmartDots should be set to a level where they may be partially present on the plate after processing but not seen in print.
- For standard Bank Light UVA main exposure in combination with Flat-Top-Dot solvent wash-out and (FTD) thermal plates. Standard water washable plates will usually perform in a similar way, so use this start-point for them.
SmartDot highlight parameters:
In combination with curve:
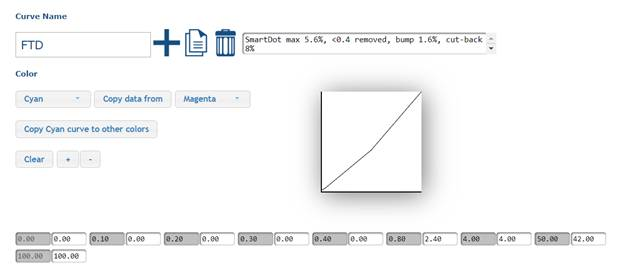
This curve will remove pixels with values of 0.4% and below (‘scum dots’) by mapping them to 0%. A cut-back curve, 8%, mapping 50% to 42% is applied to compensate for modest dot-loss. A bump-up curve of 1.6%, mapping 0.8 to 2.4% should ensure stable dots are retained on the plate. These should be checked and adjusted. SmartDots should be set to a level where they may be partially present on the plate after processing but not seen in print.
- For LED UVA main exposure in combination with Flat-Top-Dot or plates designed for LED, solvent wash plates.
SmartDot Highlight parameters:

In combination with Curve:
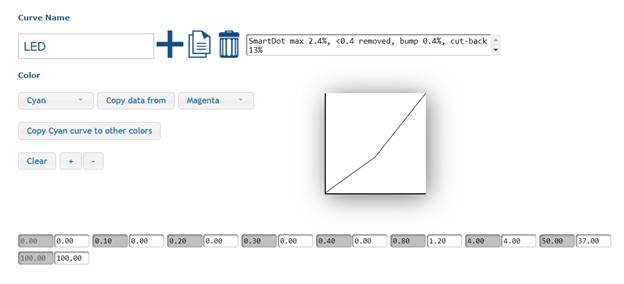
This curve will remove pixels with values of 0.4% and below (‘scum dots’) by mapping them to 0%. A cut-back curve, 13%, mapping 50% to 37% is applied to compensate almost no dot-loss giving a higher dot-gain. A bump-up curve of 0.4%, mapping 0.8 to 1.2% should ensure stable dots are retained on the plate. These should be checked and adjusted. SmartDots should be set to a level where they may be partially present on the plate after processing but not seen in print.
SmartDot behavior will vary with plates and exposure method. Particularly with LED exposure the point between their complete removal from the plate and being held enough to print may not be discernable. Even SmartDots that are completely removed from the plate after processing will probably have played a part in supporting the main FM dots through some of the wash out process making them stronger, more resilient in the printing process.